- Kiroong Choe, Seoul National University
- Chaerin Lee, Seoul National University
- Soohyun Lee, Seoul National University
- Jiwon Song, Seoul National University
- Aeri Cho, Seoul National University
- Nam Wook Kim, Boston College
- Jinwook Seo, Seoul National University
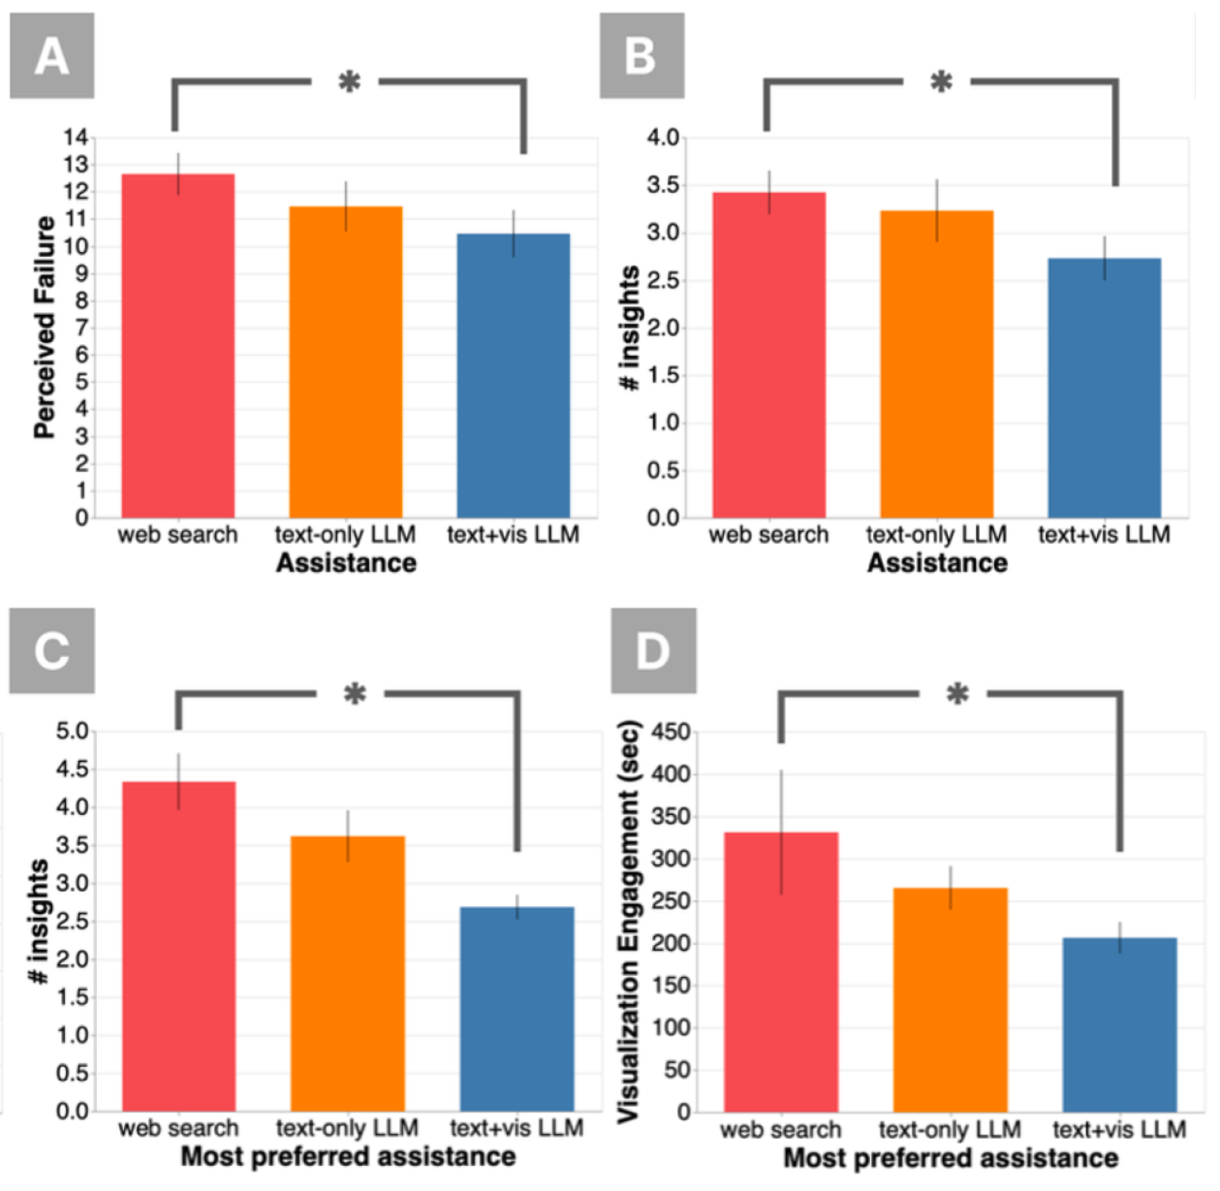
With the growing complexity and volume of data, visualizations have become more intricate, often requiring advanced techniques to convey insights. These complex charts are prevalent in everyday life, and individuals who lack knowledge in data visualization may find them challenging to understand. This paper investigates using Large Language Models (LLMs) to help users with low data literacy understand complex visualizations. While previous studies focus on text interactions with users, we noticed that visual cues are also critical for interpreting charts. We introduce an LLM application that supports both text and visual interaction for guiding chart interpretation. Our study with 26 participants revealed that the in-situ support effectively assisted users in interpreting charts and enhanced learning by addressing specific chart-related questions and encouraging further exploration. Visual communication allowed participants to convey their interests straightforwardly, eliminating the need for textual descriptions. However, the LLM assistance led users to engage less with the system, resulting in fewer insights from the visualizations. This suggests that users, particularly those with lower data literacy and motivation, may have over-relied on the LLM agent. We discuss opportunities for deploying LLMs to enhance visualization literacy while emphasizing the need for a balanced approach.
The general public increasingly encounters complex charts, but their primary resource for understanding these is often just Google.
We have facilitated chart discussions using LLM through both textual and visual annotations.
LLM and visual communication effectively onboarded people to complex visualizations but may also posed risks, such as creating performance illusions and reducing engagement.