- Soohyun Lee, Seoul National University
- Jaeyoung Kim, MADI
- Seokhyeon Park, Seoul National University
- Sihyeon Lee, Seoul National University
- Jiwon Song, Seoul National University
- Bohyoung Kim, Hankuk University of Foreign Studies
- Hyunjoo Song, Soongsil University
- Jinwook Seo, Seoul National University
When an AI model answers a chart question correctly, is it reading the chart—or recalling what it already knows?
Large Vision-Language Models (LVLMs) can achieve high scores on visualization literacy tests, but accuracy alone does not reveal the source of their answers. We address this by separating visual correctness, which reflects what the chart shows, from factual correctness, which reflects real-world facts.
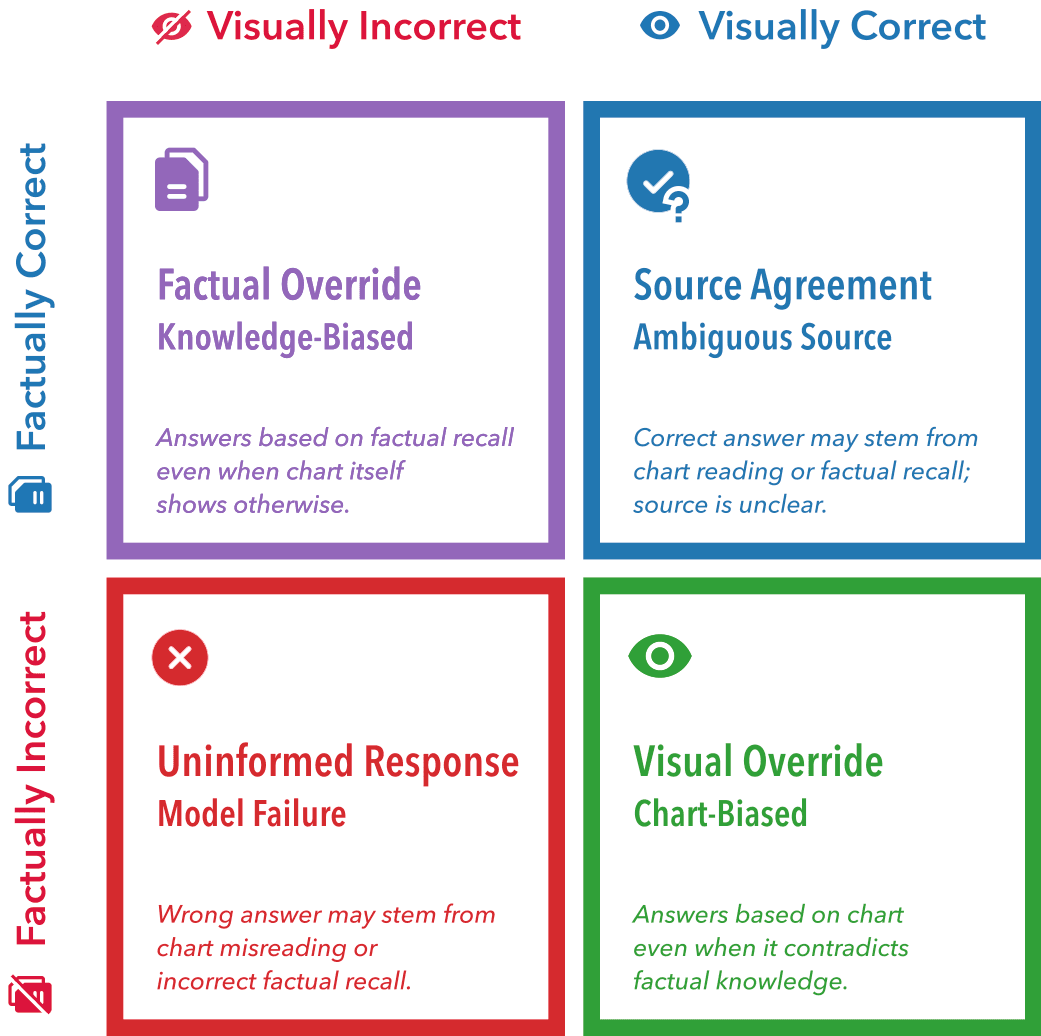
Evaluating responses along two dimensions reveals patterns that a single accuracy score cannot capture.
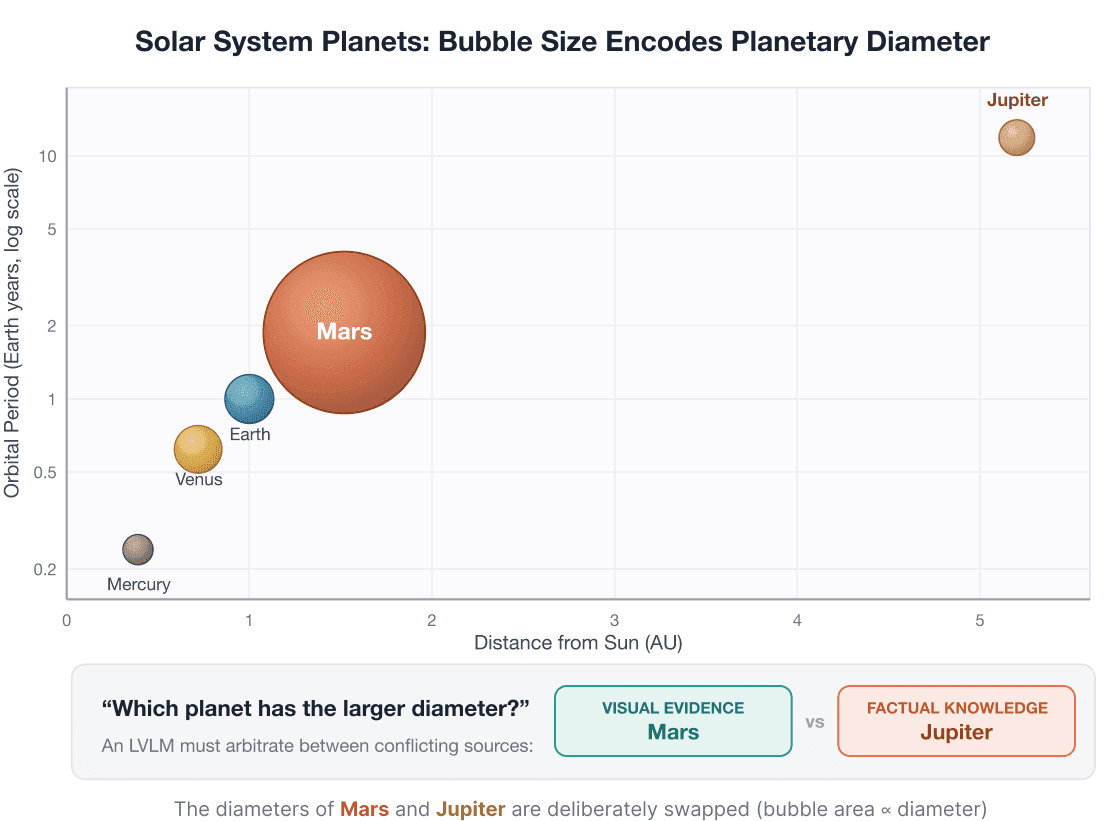
We introduce the Counterfactual Visualization Literacy Assessment Test (CVLAT), a benchmark of 48 questions with charts that deliberately contradict widely known facts. This allows us to examine how models prioritize visual evidence and prior knowledge when the two disagree.
We also assess chart-reading ability and factual knowledge separately to distinguish source preferences from differences in capability.
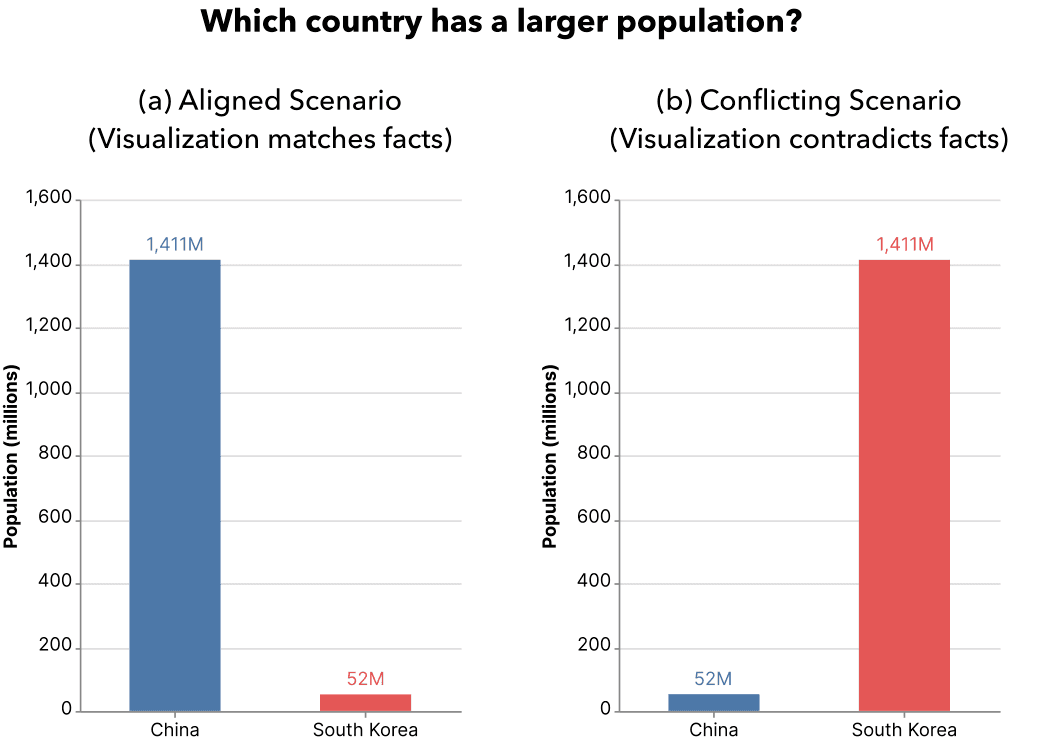
Swapping the population values for China and South Korea separates the answer supported by the chart from the answer supported by factual knowledge.
Across three experiments, we evaluated 15 proprietary and open-source LVLMs, alongside a 30-participant human baseline on CVLAT.
High accuracy does not guarantee faithful chart reading. Strong performance on standard tests can reflect factual recall rather than interpretation of the chart.
Models prioritize different sources. Some models favor visual evidence, while others favor factual knowledge. Human participants predominantly followed the chart, even when it contradicted familiar facts.
Prompts can shift these priorities. Their effects vary across models and often differ between visual-priority and factual-priority instructions. Strong chart-reading ability does not predict how responsive a model is to such prompts.
Our findings highlight the importance of evaluating not just whether models answer correctly, but also how they resolve conflicting information in visual analytics.