miRTarVIs is a visual analysis tool for miRNA-mRNA expression profile data.
In this document, I will introduce you how to use miRTarVis step by step.
miRTarVis requires
You can download miRTarVis from http://hcil.snu.ac.kr/~rati/miRTarVis/miRTarVis.zip.
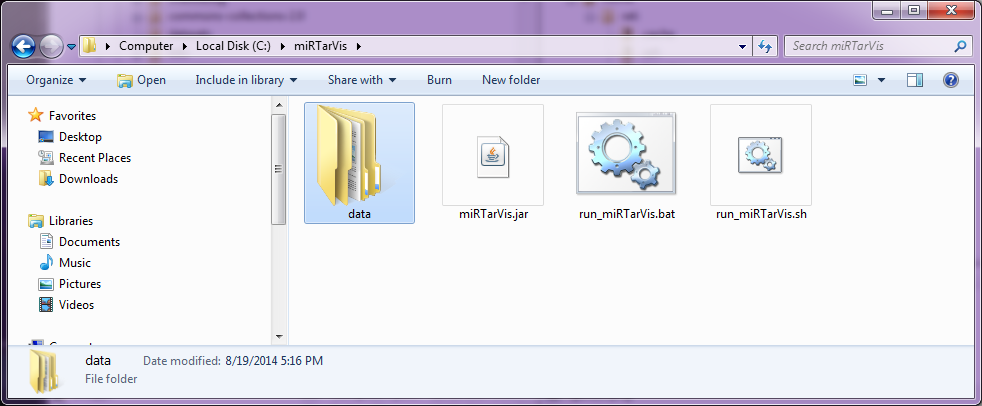
After you download and unzip the archive, it looks like this:
If you installed JAVA JRE but failed to run miRTarVis, see this document and try to set PATH for Java.(http://http://docs.oracle.com/javase/tutorial/essential/environment/paths.html)
miRTarVis looks like this:
The main menu of miRTarVis is a foldable accordion menu. Only one selected menu extends, and all the others collapses.
Menus consists of four submenus, 'load data'-'filter'-'prediction'-'visualization'.
Here I will show you how miRTarVis works with a randomly generated sample miRNA-mRNA expression profile.
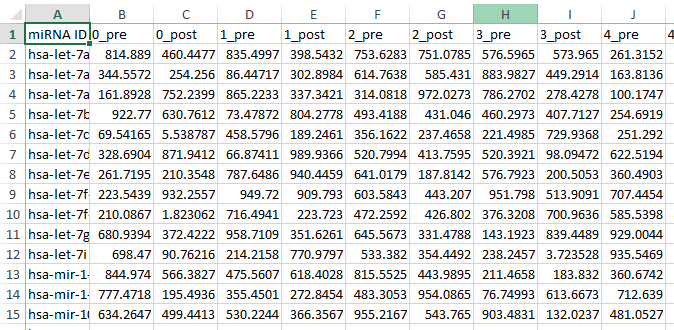
Data directory (or folder if you prefer that term) contains four sub directories. We will use (your miRTarVis directory)/data/pairedtwosample/miRNATwoCondData.csv and geneTwoCondData.csv, each contains toy miRNA expression profile data and mRNA expression profile data.
Let me describe brielfy about contents of files. They are CSV format file, whose first row contains sample names and first column contains miRBase miRNA ID for miRNA or gene symbols for mRNA. These two files contains expression level for all samples, all miRNAs (or mRNAs), and for each miRNA(or gene)-samples, they measured twice (treatment vs. control). All values in the data were randomly generated in the range of 0 ~ 1000.
In load data menu, you can see five types of input data on the left side. Select "A) Paired two-sample" (selected by default), and choose two files, one for miRNA expression file and the other for mRNA expression file. Do not confuse with the order of the two files! Select the button on the below to start load data. You can see loading progress.
After loading these two data, miRTarVis calculate p-value and fold change automatically. Also, it data distribution using histogram of fold change. Image below shows how it looks like after finishing loading.
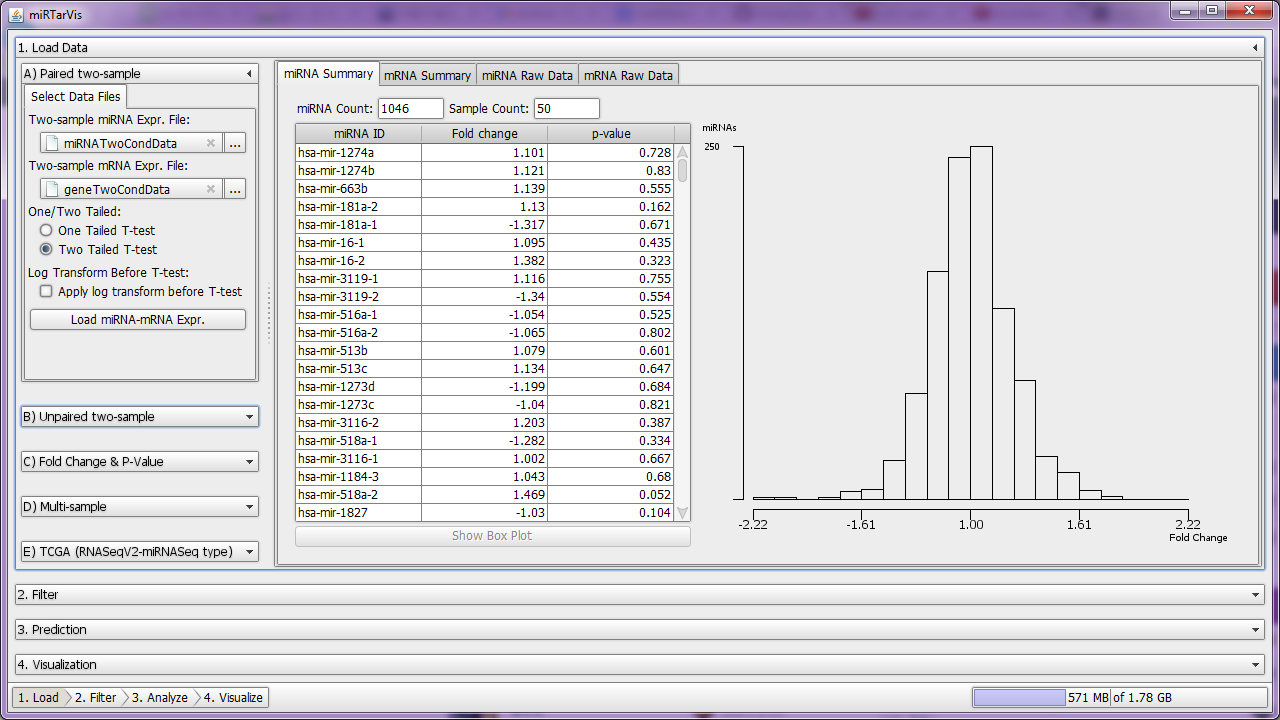
Well, the histogram looks like that the data is well normally distributed in a good bell shape, but as data is randomly generated it is expected to be trivial.
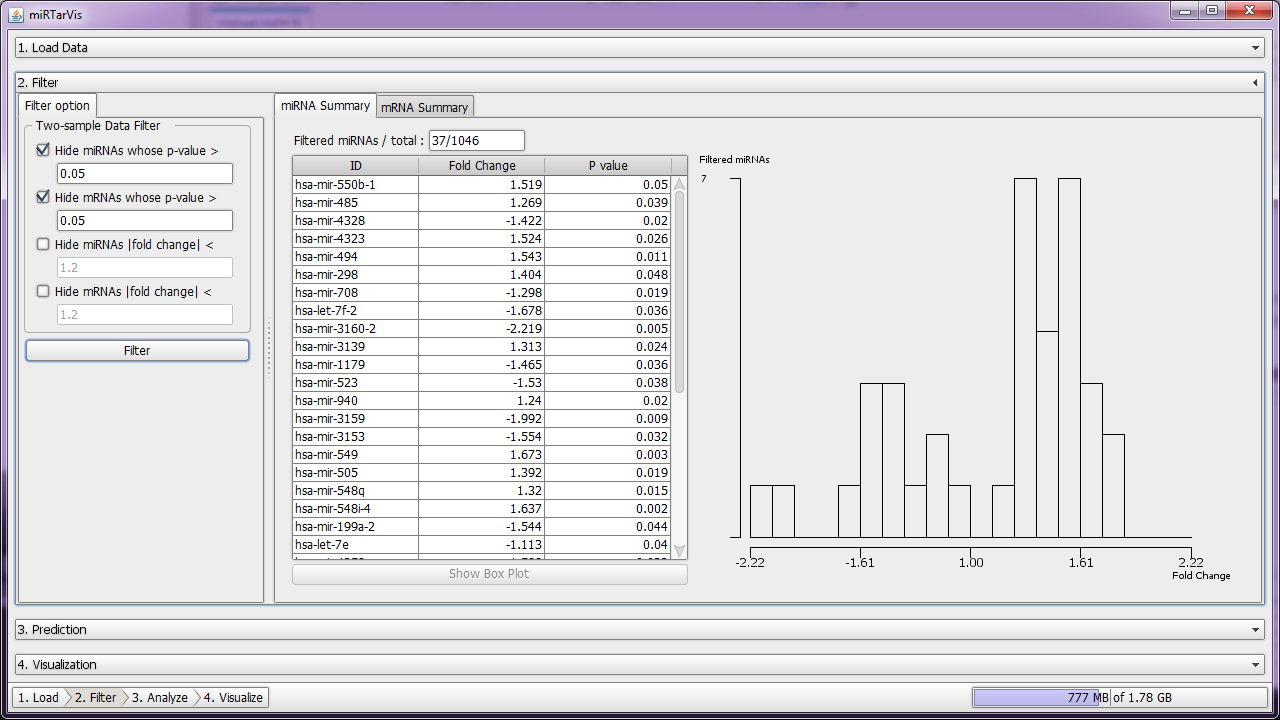
Let's go to the next step. We want to search for differentially expressed miRNAs and mRNAs. As we have p-value for each miRNA and mRNA, it seems a good idea to use p-value to identify differentially expressed miRNAs and mRNAs. Let's click '2. Filter' menu in miRTarVis. Then it shows interfaces for filtering the data. For now, filter the data by p-value of value 0.05 for both miRNA and mRNA.
This image shows results of filtering. As expected, you can see in the histogram that the more a miRNA changed, less p-value it has.
The next step is prediction. miRTarVis searches for possible miRNA-target pairs for the filtered data. miRTarVis supports two sequence-based prediction algorithms (TargetScan and microRNA.org) and four expression profile-based prediction algorithms (correlation analysis, mutual information, GenMiR++ (Beysian inference analysis), MINE analysis).
For now, let's use the simplest one, correlation analysis. It searches for miRNA-mRNA pairs which have high correlation coefficients. See this image first.
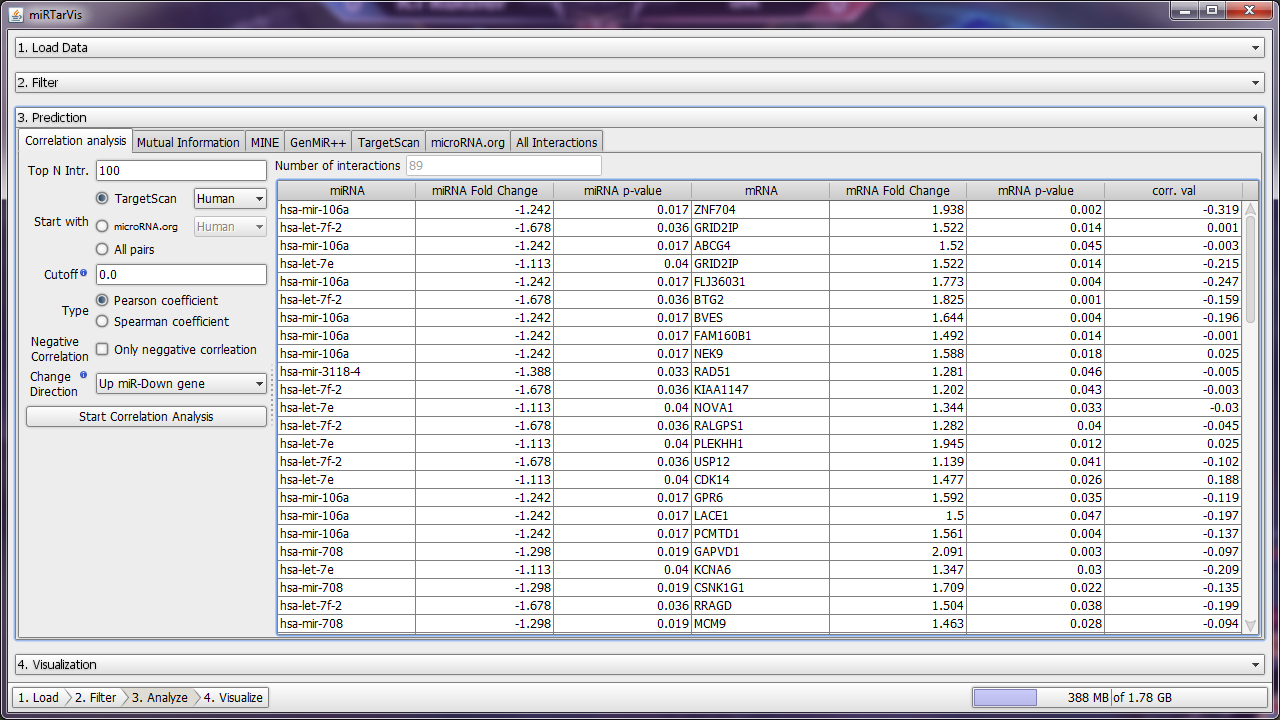
These are results of target prediction by correlation analysis. Let's see arguments on the left side.
After setting arguments like this, if you press the Start button, miRTarVis shows results in a table after finishing calculation.
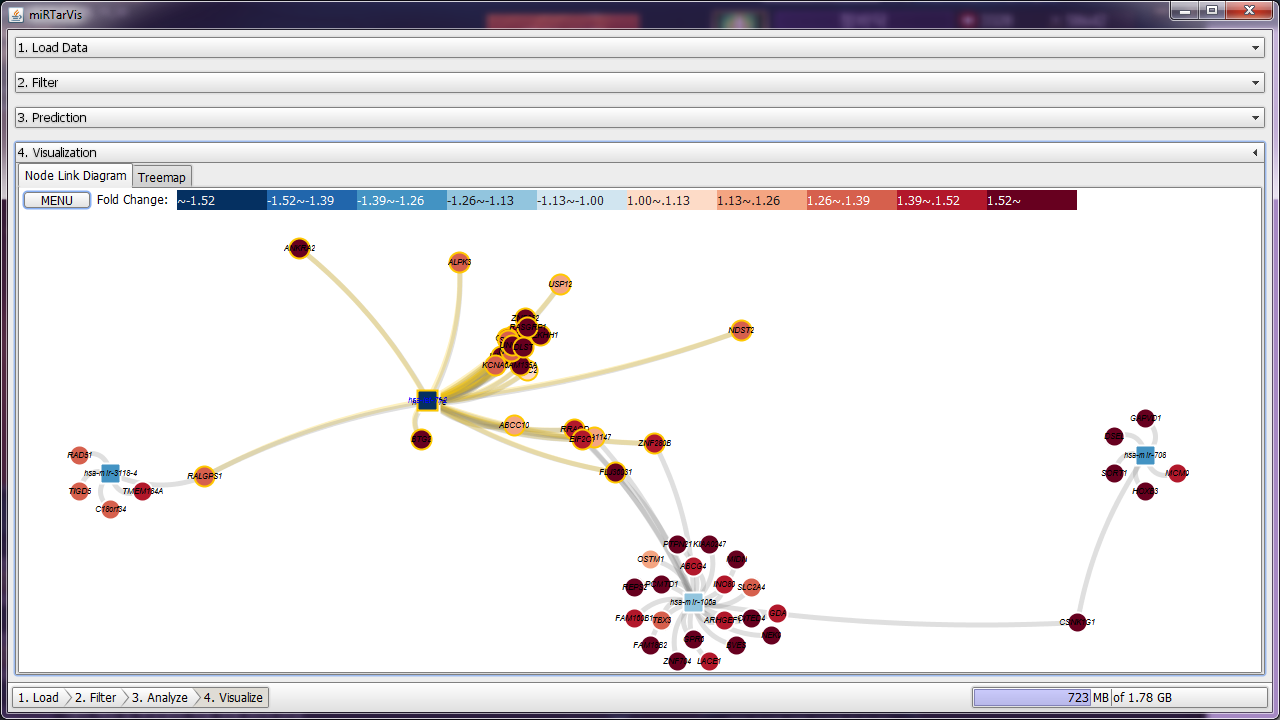
Now we have possible miRNA-mRNA pairs in hand! miRTarVis visualizes the miRNA-mRNA network to help you understand the miRNA-mRNA network structure. Traditionally, this kind of network is visualized using a node-link diagram, and miRTarVis also supports a node-link diagram.
There are four layout algorithms that miRTarVis supports, and we think ISOM layout or KK layout will show the structure of the network well. ISOM has the problem of occlusion, but they preserve the topology between nodes better. Following images shows the network in both layout algorithm. In this example, it looks that KK layout is neater (ISOM is up). You can change the layout by click the menu button at the upper left corner.
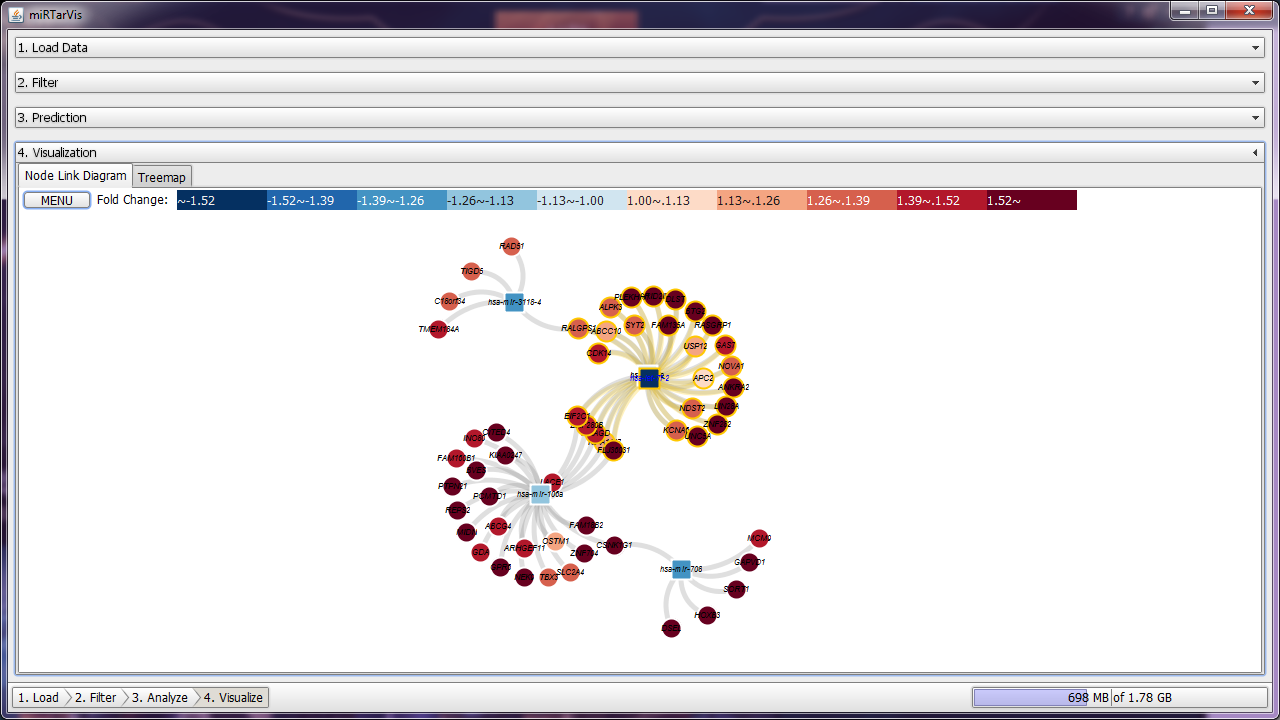
You can select a node and highlight its neighbors, or you can move a node by dragging. If you click a miRNA and shift-click another miRNA, then miRTarVIs highlights all their common targets. miRTarVis supports zoom in/out using mouse wheel interaction. Please try this yourselves!
In addition, miRTarVis shows the network in treemap visualization. See the following image.
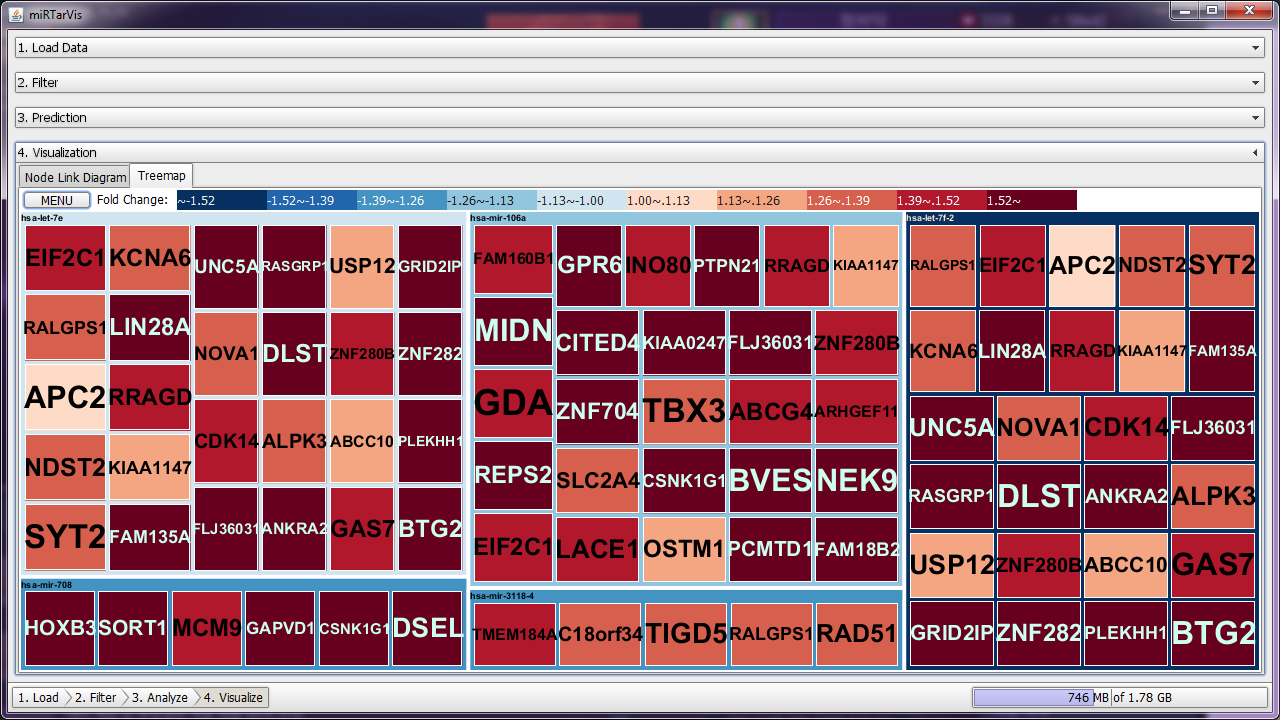
This visualization shows the same network that node-link diagrams did. This two-level treemap shows miRNAs as first level nodes and their targets as their child nodes. However, if multiple miRNAs target the same miRNA, then it is hard to catch that in treemap visualization. Therefore, we give you a clue to see such relationship. If you hover mouse pointer over an mRNA node, then the treemap will only highlight that mRNA and its parent nodes. See the image below.
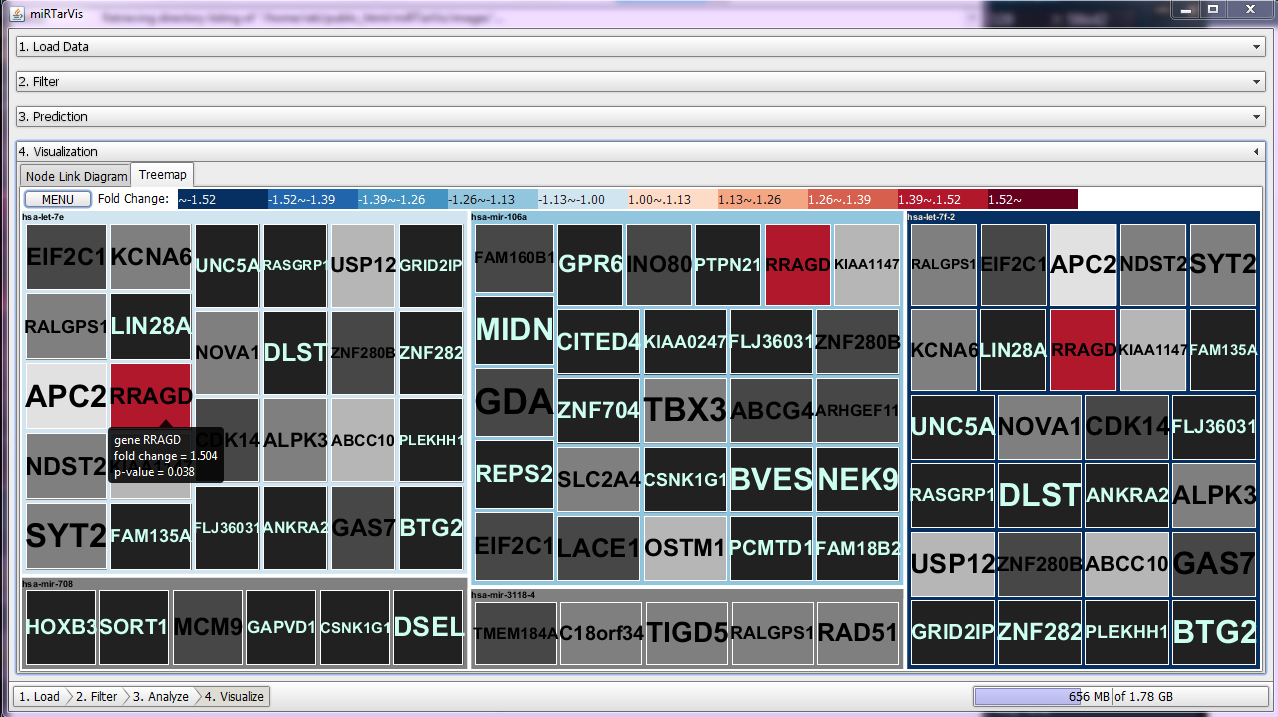
In both visualizations, color represents fold change values of miRNAs and mRNAs.
There were other functions such as link to external databases in both the visualizations. You can do this by right-click a node in node-link diagram or treemap. I want end this tutorial with one of these functions: Term Enrichment analysis in Gene Ontology web service. If prediction result is biologically meaningful, we can expect that predicted targets of a miRNA has common biological function. To help verifying that, miRTarVis provide a link to Term Enrichment analysis from Gene Ontology web service.
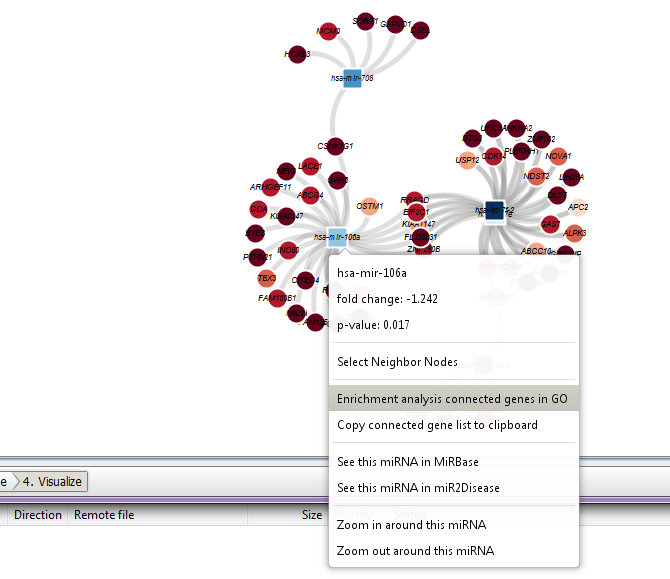
If you click the "Enrichment analysis connected genes in GO" in a context menu,
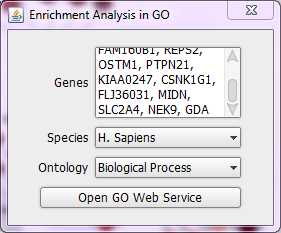
a dialog will appears like this. It shows all predicted targets of miRNA (hsa-mir-106a for here). After setting species and ontology as you want, let's click 'Open GO Web Service' button in the dialog. Then, enrichment analysis result will appear in your default browser like this:
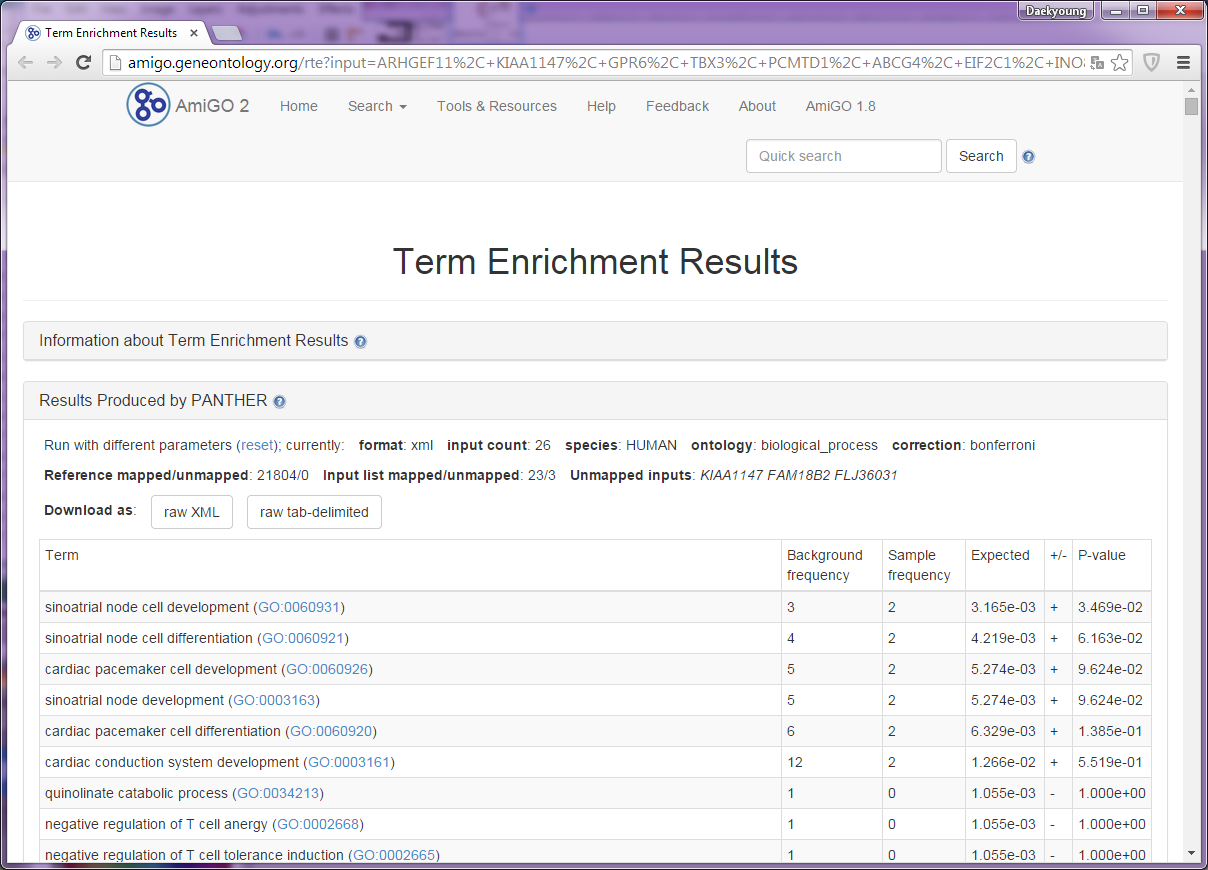
Sometimes the network request times out when there are many target mRNAs, so no results will appear after long time. In such circumstances, please try it again.
This is the end of this miRTarVis tutorial. If you have any question, please email me (rati@hcil.snu.ac.kr).