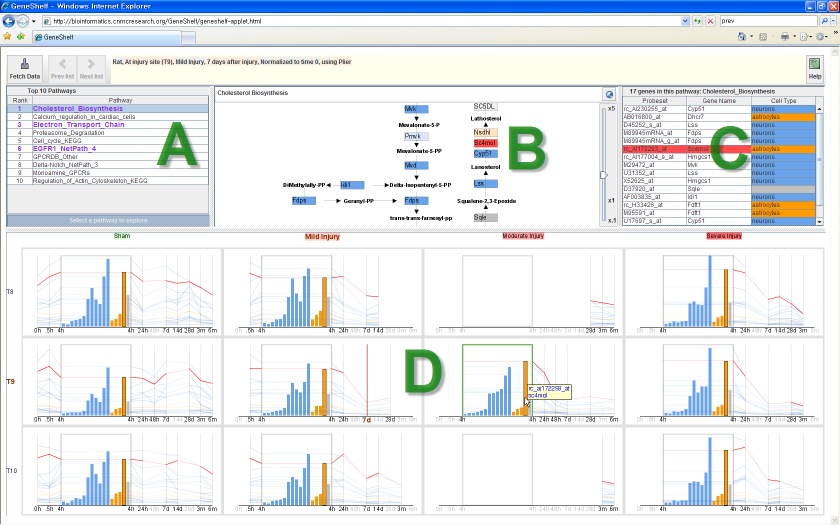
GeneShelf showing a relevant genetic pathway at the injury site
(T9), 7 days after a mild spinal cord injury at a vertebral level
T9. The highlighted "hmgcs1" is very active across all
experimental conditions. When users mouse over an item representing
a gene in a view, the corresponding items are highlighted in red in
all other views.
There are four visualization components in GeneShelf:
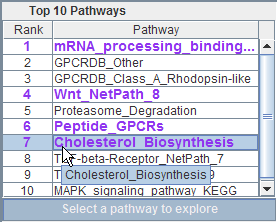
- Top 10 pathway list view (A)
- It shows the top ten pathways relevant to a user-selected experimental condition.
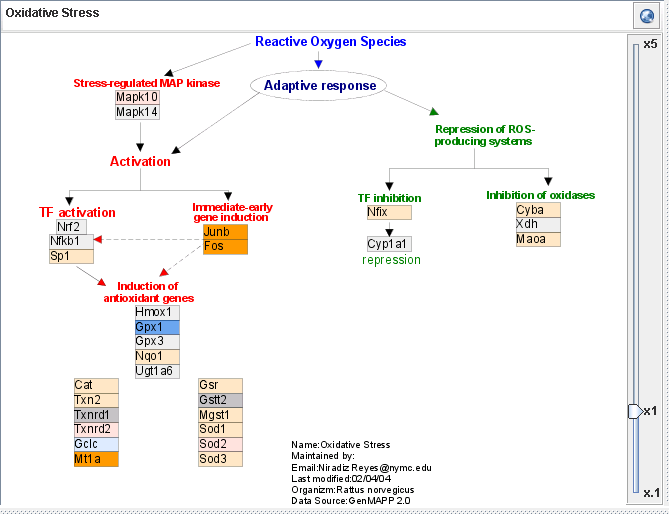
- Pathway view (B)
- It is a zoomable lightweight pathway visualization tool.
- Gene list view (C)
- It shows gene names and other annotations for the current pathway.
- nTimeLines grid view (D)
- It shows the two dimensions of the study design: the horizontal axis shows the severity of injury, and the vertical axis shows the sampling location relative to the injury site. The severity of spinal cord injury becomes severer (sham, mild, moderate, and severe) from left to right. For each severity column, there are three sampling locations (T8: above injury site, T9: the injury site, and T10: below injury site) from top to bottom.
If you do not have Java installed on your computer, you have to install Java (Java SE Runtime Environment 6 or higher) first to launch GeneShelf. If you are prompted to install a new Java after clicking on one of the links above, you have to install it first. To properly run GeneShelf, Sun's Java Virtual machine is necessary. You can download it from the Java SE Downloads page.
Steps to utilize GeneShelf
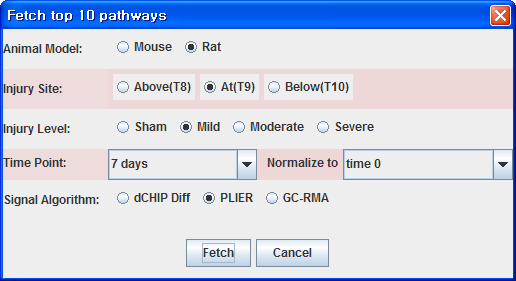
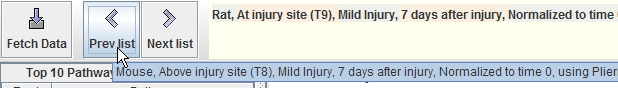
- Revisit previous/next reference conditions
-
Right next to the "Fetch Data" button, there are two more buttons:
"Previous list" and "Next list." GeneShelf keeps the history of 10
recently fetched reference conditions. Users can revisit those
reference conditions by clicking these two buttons. When users
mouse-over a button, GeneShelf shows a reference condition that
will be reloaded when pressing the button.
Please note that the data fetching can take about 10 - 15 seconds in a typical LAN environment
-
Zoom (
 video)
- You can zoom in and out the view using the vertical slider to the right side of the view.
-
Pan (video)
- You can pan the view by dragging the mouse with the left button depressed.
- Color coding
- In order to provide neuroscience researchers with more context to understand the SCI project, GeneShelf renders boxes for genes using different colors according to the cell type information suggested in a neuroscience paper. There are three neural cell types: astrocytes, neurons, and oligodendrocytes. We color-coded the third column of the gene list view according to the neuron cell type: orange for astrocyte, blue for neuron, red for oligodendrosyte, and gray for the undefined. We used the same color-coding scheme throughout all other views. If a gene in the current pathway is not present in the dataset, the box for the gene is rendered in an attenuated color.
- See the current pathway at WikiPathways.org
- At the top of the pathway view, you can see the name of the current pathway. If you want to see the pathway at the WikiPathways.org site, just click on the button at the top right conner of this view.
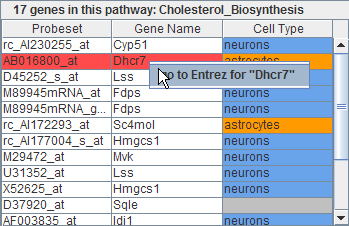
- Color coding
- In order to provide neuroscience researchers with more context to understand the SCI project, GeneShelf has a column in the gene list view that shows the cell type information suggested in a neuroscience paper. There are three neural cell types: astrocytes, neurons, and oligodendrocytes. We color-coded the third column of the gene list view according to the neuron cell type: orange for astrocyte, blue for neuron, red for oligodendrosyte, and gray for the undefined. We used the same color-coding scheme throughout all other views including the pathway view and the nTimeLines grid view.
- Interactive coordination of all views
- Whenever users mouse over on an item representing a gene at any one view, the corresponding items in all other view are also highlighted in red.
- Link to NCBI to learn more about the selected gene
- When users find an interesting gene in this gene list view, they can right-click on the corresponding list item to see a popup menu where they can click on the gene name to visit the detail information page for the selected gene at the NCBI website.
In each grid block, a gene is represented by a line graph.
-
Zooming in and out a grid block (video)
- GeneShelf implements the fisheye view. Users click on anywhere in the background of a grid block to smoothly enlarge the grid block and shrink other grid blocks. If users click again on the enlarged gird block, all the grid blocks return to the regular size, in which all the blocks have an equal size. GeneShelf smoothly animates upon enlarging and shrinking grid blocks.
-
Expanding/Closing a time point with nTimeLines (video)
- It is often hard for users to compare multiple gene expression patterns at a specific time point in a traditional timeline view. We improved the traditional timeline view to address this problem by enabling users to expand a time point. A mouse-over on a vertical line or label for a time point highlights the time point in red, indicating that this time point can be expanded. When users click on the vertical line or label for a time point, the selected time point slides open to have two vertical lines representing the same time point, between which GeneShelf shows a bar chart for the gene expression values at the time point. Parallel horizontal lines will connect the two duplicate vertical lines representing the selected time point. Each bar represents a gene. The height of each bar for a gene will exactly reach the parallel horizontal line that represents the same gene. GeneShelf shows a gray bounding box surrounding the bar chart to indicate that the whole enclosed area represents a single time point. Users can close an expanded time point either by clicking on the time axis or label for the expanded time point or by clicking on the background of the bar chart.
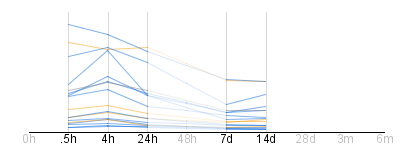
- Missing value representation
-
When there is no gene expression data at a certain time point,
GeneShelf does not show the vertical line for the time point and
the time label is attenuated from black to light gray. When
drawing line graphics, missing values are interpolated and the
line segments passing the missing time point are attenuated.
GeneShelf does not display line segments at any leading time
points with missing values. Likewise, GeneShelf does not show line
segments for any trailing time points with missing values. For
example, there is no gene expression data available at 0h, 48h,
28d, 3m, and 6m in the following figure. Labels for the time
points are shown in light gray. For leading time point (0h) and
trailing time points (28d, 3m, and 6m), GeneShelf does show
neither the vertical line for those time points nor the line
segments passing the lines. For 48h, the missing gene expression
values are interpolated using the neighboring time points (24h and
7d), but the line segments passing the 48h time point are rendered
in much lighter color to indicate that they are not real values.
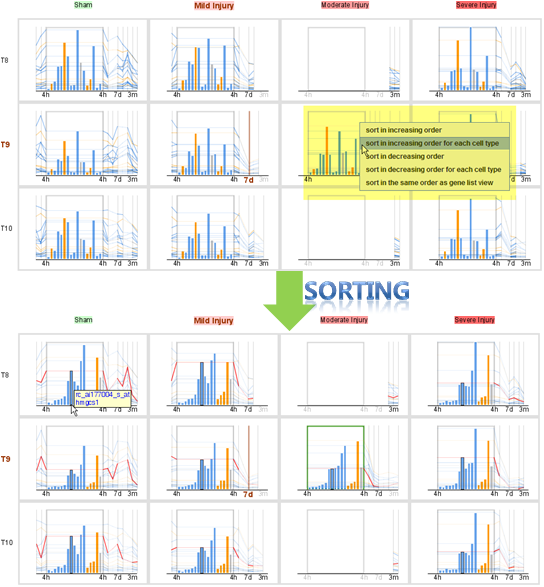
- Sorting the bar chart at nTimeLines view
-
The nTimeLines view enables users to sort the bar chart embedded
in the view in 5 different ways: increasing/decreasing order of
gene expression values, increasing/decreasing order of gene
expression values for each cell type, and the same order as in the
gene list view. Users can right-click on the background of a bar
chart in an nTimeLines view to select a way to sort the bar chart.
For example, in the following figure, the user right-clicks on the
bar char in the grid block for moderate injury at T9 (injury site)
at the 4h time point and selects the popup menu item to sort the
bar chart "in increasing order for each cell type," which results
in the sorted view shown in the following image (top). All
corresponding bar charts in other grid bocks are arranged in the
same order as in the selected bar chart that is highlighted with a
green bounding box (bottom).
- Interactive coordination of all views
- A mouse-over on a line graph or a bar in a bar chart of an expanded time point in a grid block causes the corresponding line graphs and bars in all other grid blocks to highlight in red. It also highlights corresponding gene nodes in the pathway view and the corresponding list item in the gene list view.
- Color coding
- GeneShelf adopts the same color coding for this view: orange for astrocyte, blue for neuron, red for oligodendrosyte, and gray for the undefined.
- Link to NCBI to learn more about the selected gene
- When users find an interesting gene in this nTimeLines grid view, they can right-click on the corresponding polyline to see a popup menu where they can click on the gene name to visit the detail information page for the selected gene at the NCBI website.
If you see an error message like "DBMS is down," please let us know that. Our Oracle DBMS server sometimes becomes unstable to keep GeneShelf from getting data. We check our DBMS everyday to see if it's working well, so GeneShelf will be working properly again within a day or so.