| 1. | What is ConSet? |
| ConSet is an interactive visualization tool with which users can effectively examine relationships among multiple sets at once. ConSet provides an overview using an improved permutation matrix to enable users to easily identify relationships among sets with a large number of elements. Not only do we use a standard Venn diagram, we also introduce a new diagram called Fan diagram that allows users to compare two or three sets without any inconsistencies that may exist in Venn diagrams.
ConSet is based on the visual information seeking mantra. |
| | |
| 2. | Download and Installation |
| ConSet is freely downloadable for non-commercial
use (academic and/or research purposes) from the download page. |
| | |
| 3. | How to Load a Dataset |
| Open a tab-delimited text file with two columns - element and set |
|
File->Open a list
Example:
element1	set1
element2	set1
element3	set1
element1	set2
element3	set2
element3	set3
element4	set3
|
| Open multiple text files - each file is for one set |
|
File->Open
- Select multiple files on the file open dialogbox
- File names are set names in ConSet
- In each file, put one element in a row
- You can get the same result as with the previous "Open a list menu" if you select the following three text files:
| set1.txt | set2.txt | set3.txt |
element1
element2
element3
|
element1
element3
|
element3
element4
|
|
| Open GOMiner Export Files |
|
File->Import GOMINER results
- ConSet can import GOMiner results in two text files.
- How to export two text files from GOMiner.
- After running GOMiner, select a gene ontology and right-click on it to open a popup menu.
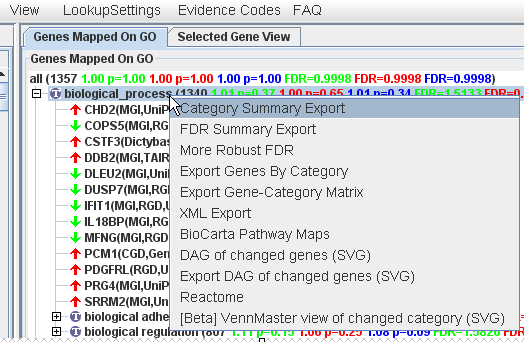
- First, select "Category Summary Export."
- Second, select "Export Genes By Category."
- You are going to see "Import GOMiner Results" dialogbox.
- Import GOMiner Results Dialogbox:
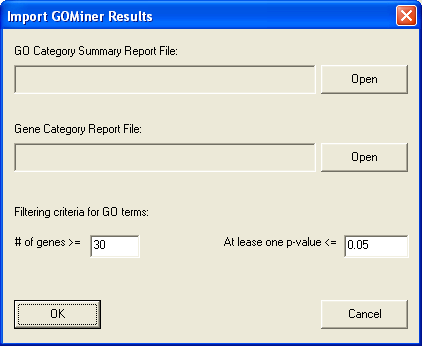
- Select "GO Category Summary Report File."
- Select "Gene Category Report File."
- Define your filtering conditions for GO terms." If conditions are too strong, there will be no set (GO terms) left.
- ConSet will treat GO terms as sets and gene products as elements.
|
| | |
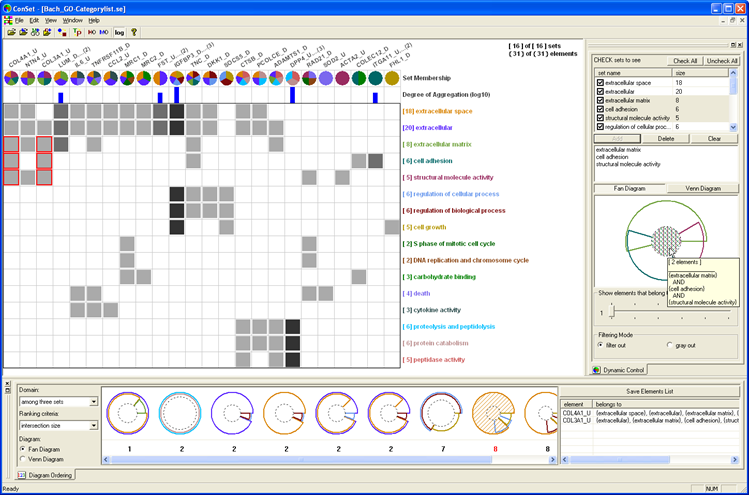
| 4. | Overview with Permutation Matrix |
| 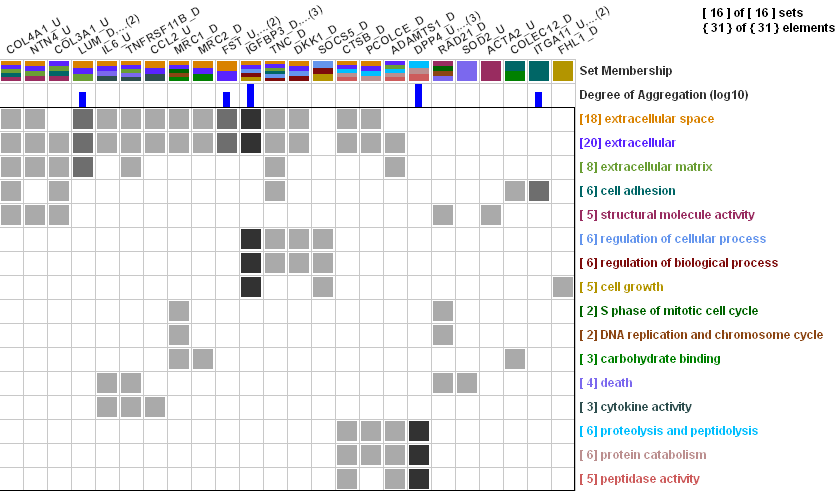 |
| Basics |
|
- Each column represents an element.
- Each row represents a set.
- When an element belongs to a set, a corresponding cell is filed in gray.
- Each set is given a distinctive color and the set name is displayed at the end of its corresponding row in its own color.
- Users can deal with up to 32 sets in ConSet because of the limit on the number of distinctive colors.
- Column headers:
- 1st row: Element Name row shows the name of representative element for the column. When several elements are aggregated to a single column (because they belong to the same set of sets), only the representative element that comes first in alphabetical order is shown in the permutation matrix, and other aggregated elements are hidden. The number in a parentheses represents the number of elements that belong to the same set of sets as the representative element.
- 2nd row:Set Membership row shows pie-chart-like glyphs, where each pie piece represents a set to which the corresponding element belongs and is filled with the color of the set .Users can change the shape of the glyphs in this row using the toolbar:
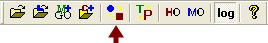
- 3rd row:Degree of Aggregation row shows bar graphs with the number of aggregated elements. The height of each bar is proportional to the number of aggregated elements and users can show the bars either in log scale or in linear scale. The intensity of a cell in the permutation matrix is also proportional to the number of aggregated elements. Users can change the scale using the toolbar:
- Users can also try a Treemap layout for an overview.
|
| Rearrangement |
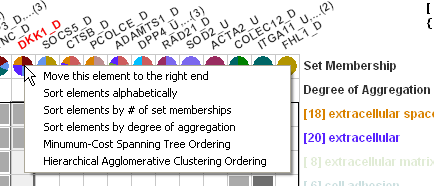
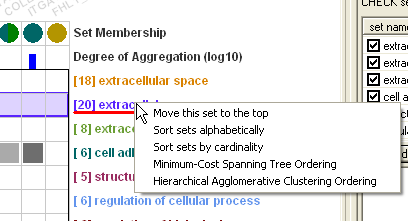
| Users can rearrange columns and rows in several ways. |
|
Right click on a column title:
|
Right click on a row title:
|
|
| | |
| 5. | Filtering |
| Dynamic Element Filtering |
|
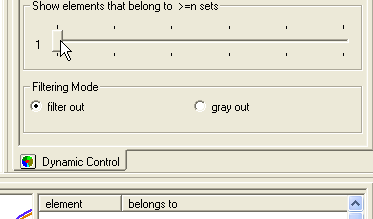
| "Filter elements to show" slider control with a value t filters to show only elements that belong to at least t sets. Filtered elements or sets can either be removed from or be grayed out in the Permutation Matrix view based on the "Filtering Mode". |
 |
|
| Manual Selection of Sets to Filter Out or to See Details |
|
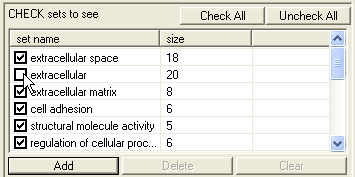
| ConSet, by default, shows the names of all the sets in the sets list in the Dynamic Control view. It allows users to change the visibility of sets in the Permutation Matrix view. When users check (or uncheck) a check box right before a set name in the sets list, ConSet shows (or hides) the set in the Permutation Matrix view. |
 |
|
| | |
| 6. | Detail Views |
|
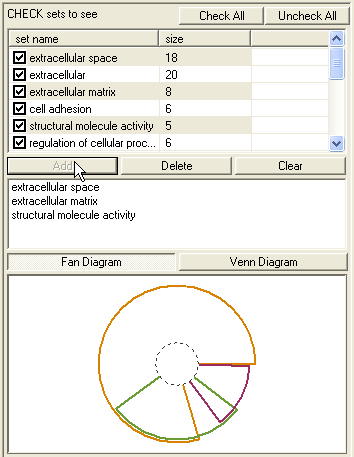
| ConSet visualizes the relationship of two or three sets in the diagram area in the Dynamic Control view. Users can add up to three sets into the diagram area from the sets list. When users select a set in the sets list, the corresponding set is highlighted in the Permutation Matrix view while the names of all the elements of the selected set are shown in the elements list. When they click the "Add" button at the bottom of the sets list, selected sets are added to the diagram area. The names of added sets are displayed in the upper window of the diagram area and a diagram of their relationship is drawn in the lower window of the diagram area. Users can remove sets from the diagram area by clicking the "Delete" button after selecting them from the upper window. They can also clear the diagram area by clicking the "Clear" button. |
 |
|
| Fan Diagram: a novel dagram to show set relationships without inconsistencies with up to three sets |
|
Two Sets
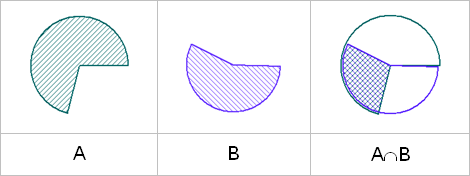
Assign a pie slice of a circle according to the cardinality of each set and their interaction.
|
Three Sets
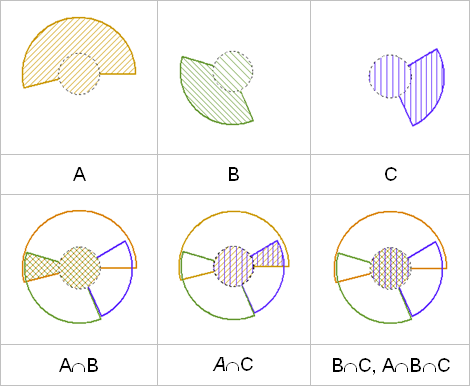
Assign a smaller center circle to the intersection of the three sets and assign the remaining donut shape area to each set according to cardinality.
|
|
| Elements list and Sets list |
| ConSet shows detailed list of sets or elements in the list control at the bottom right corner. This list control is coordinated with the permutation matrix view and the Fan/Venn diagram. |
| | |
| 5. | Rank-by-Feature Framework: Ranking set relationships |
| 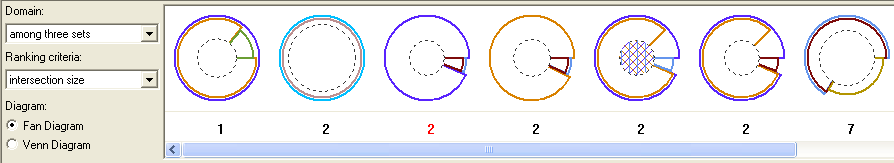 |
| Users can rank set relationships in ConSet. From the "Domain" combo-box at the top left corner of the view, users can select the ordering of diagrams between two or among three sets. Two ranking criteria are provided in the "Ranking criteria" combo-box. The criterion "intersection size" ranks diagrams by the size of the intersection, and the criterion "overlap metric" orders diagrams by the ratio of the intersection set size to the union set size. This helps users easily capture a collection of important sets that meets the ranking criteria. Users can see each of the top 10 ranked diagrams in two ways: as a Venn diagram and a Fan diagram. |
| | |